

On June 13th, the Pew Research Center published the results of their recent survey of 1,197 LGBT people. The survey, which was administered in order to “explore the attitudes and experiences of the people most affected by [the sharp increase in support for same-sex marriage and the two cases pending before the U.S. Supreme Court,]” confirmed many of the assumptions we’ve made about LGBT people.
A whole 92% of queers believe that things have gotten better for us over the past 10 years and will continue to improve in the next decade. Yet LGBT people are more likely than the general public (53% v. 39%) to believe that their own group faces a lot of discrimination. Other notable – if predictable – findings showed up in every realm from religion to politics to family structure. Unsurprisingly, the vast majority (79%) of the LGBT community identify as Democrats or left-leaning independents. Compared to the general population (which reports a 20% rate of unaffiliation), nearly half of LGBT adults have no religious affiliation.
And so with all this in mind, we’re going to wade into the somewhat less-expected findings in the study and figure out what, exactly, acceptance means.
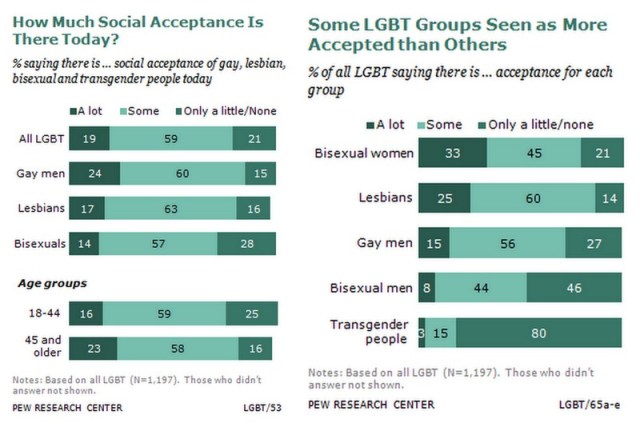
The idea of “acceptance” obviously goes much deeper than a number from a survey. In an early chapter of the results, the authors discussed how individual groups in the LGBT spectrum different in their perception of acceptance. Gay men are more likely to believe in widespread social acceptance, followed by lesbians and finally, bisexuals. Trans* people were notably absent from many charts included in the report. Any questions as to why bisexuals are more pessimistic or why gay men have a sunnier outlook on acceptance has to take more into account than just that group’s experience with larger society. Gay men, for example, reported verbal and physical harassment at much higher rates than gay women or bisexuals. When asked how much each individual group experiences acceptance, it was nearly universally agreed that bisexual women are the most accepted, followed by gay women, gay men, bisexual men and trans* people.
The survey also looked at acceptance through the lens of religion. Pew asked the respondents to categorize six major religious institutions (the Muslim religion, the Mormon Church, the Catholic Church, the Jewish Religion, Evangelical Protestant churches and non-Evangelical Protestant churches) as friendly, neutral or unfriendly towards LGBT people. Though they rated Islam as the least friendly and non-Evangelical Protestant churches as the most, this perception is not aligned with how members of these institutions feel about their religions. Mormons were the most likely to believe that their religion should discourage homosexuality while Jews were most likely to think that they should be affirming.
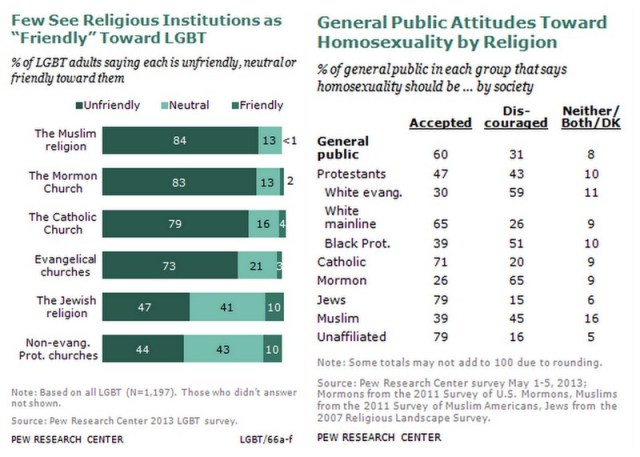
It should be emphasized that in no way are LGBT people and religious people separate groups; 51% of LGBT respondents identified themselves as belonging to a religion. Yet the disconnect between how members of different religions and queers feel about attitudes towards homosexuality could reveal that a bias against Islam and towards more normalized religious traditions is alive among LGBT people.
The connection between marginalized communities was highlighted in a series of questions about identity and community. 44% of respondents of color view their queer identity as very or extremely important, compared to 34% of whites. When discussing the positive or negative impact that being LGBT has had on his life, one respondent, an 83-year-old gay man, that that his identity had improved his life by “[making] it possible to better understand the problems facing blacks, women, others who are ‘closed out’ of society.”
This ability to empathize with other may explain why LGBT people are more likely to skew left than the general population. This segment of the population is more likely to be in favor of the Supreme Court, gun control and a larger government with more services. This last finding – in favor of big government – is especially interesting because, historically, the government hasn’t shown much support for LGBT people. Perhaps this is why so many respondents report satisfaction with the direction the country is taking.
As we continue to come out in droves, studies like this will find a place in a society that’s still learning to adjust to our presence. Not only do they show that we exist in every corner of the country, age-bracket, race and creed, they help direct creation of social policy that will bring protection of our rights and change in the places we need it most. Which, as a final note: 39% of respondents believe shouldn’t necessarily be marriage as it distracts too much from all the other issues.


Comments
This study is a good example how the source of such an offering is more important than the methodology used. From what I’ve seen, it has no racial or socio-economic differentiation component to the study, nor rural vs. urban. It has a low sampling of lesbians and a miniscule bordering on absurd sampling of trans people (nor does it bother identifying who is a trans person). Yet the study persists in saying it’s discussing LGBT issues… which is really disingenuous. And it’s being widely reprinted, referenced and linked to why… because it’s from Pew. And this is so typical of how we allow organizations which might be highly ignorant (or disinterested) in the intersectionality of our community’s issues yet, because they’re mainstream, are given instant cred which they don’t deserve.
totally with you on being unsure why they call this a study on “lgbt” america when t people are only 5% of the data. it also lade trans* lbg people choose if they wanted to complete the study as a trans* person or as an l/g/b person which makes next to no sense.
re: race. they did ask about race and ethnicity! they just didn’t report on it in any other findings other than the one tiny thing about how poc lgbt people tend to view their lgbt identity as more important than white lgbt people. which is pretty much like not asking about it. hmmph.
I don’t understand how the LGBT community can think bisexual women are the most accepted group. Most accepted by the straight community or in general? I believe the reason bisexuals feel less accepted than anyone else is precisely because of the graph to the right. I rarely to never get a warm acceptance from lesbians and straight people relate bisexual to the word “whore”. So if the question is: Are bisexual women accepted by asshole men in bars and on TV?.. the answer is yes. Otherwise, I’ve not been able to find any community that accepts me right off the bat. I believe that’s where the pessimism comes from. ;)
totally confused by this too. this really weird thing is that the plurality (40%) of respondents were bisexual.
It only seems like a “plurality” because the survey does not divide bi folks by gender:
“The sample comprised 398 gay men, 277 lesbians, 479 bisexuals and 43 transgender adults.”
Also only using 43 trans* people on a survey who’s statistical method highly relies on quantitative sampling is just a NO-NOOOOOOOOO!
Ohmygosh. You’re so right.
An even more fundamental issue is what do they even consider the “transgender” community? They never define what/who that even is? So (as with the Williams Institute study which some of this seems to carry over from) they’re supposedly counting a group for whom they don’t even bother to define the parameters??!! Moreover, many segments of the trans community are a LOT more closeted (eg heterosexual crossdressers) and, honestly, just aren’t going to answer some questions by a stranger on the phone even when paid $20. Moreover, I see no indication they actually contacted trans people who ID as heterosexual at all. A large portion of the African American and Latino trans population (especially among MAAB people) are involved in heterosexual relationships and removing this group from any portion of the sampling would seriously skew figures. At the very least, this issue should have been discussed.
Yes, they do mention racial background on the methodology page, but never bother to separate the responses by race or economic background which, as Laura said, makes it literally a waste of time. Already in the 24 hours since it’s been out, this survey has been linked/referenced and quoted more than last years’ NCTE trans survey which was far more extensive (albeit with its own issues of representing non-white and poor populations proportionally). Just because something is issued by the Pew center doesn’t mean it’s worth taking seriously. :(
Yeaahhhh I was going to say.
Thank you for pointing that out Gina! If college taught me one thing, it’s that if you want, you can make research say whatever you want it to. This study is an obvious example of that.
Also LOLing at the idea that bi women are more accepted… I sure don’t always feel that way!
I think the question to all LGBT participants about what they think which group is more accepted is actually not that important as it only relies on speculations.
But if you look into actual indicators of acceptance like feeling save to be “out” as bisexuals for example, you will see that bi folks struggles with that: http://www.pewsocialtrends.org/files/2013/06/SDT-2013-06-LGBT-3-01.png
Or if you look up community related stuff like the amount of LGBT-friends:
“Gay men are more likely than lesbians or bisexuals to have a lot of LGBT friends. Some 22% of gay men say all or most of their close friends are LGBT, compared with 12% of lesbians and 5% of bisexuals. Among bisexuals, fully half say only a few (41%) or none (12%) of their friends are LGBT. Bisexual men are much more likely than bisexual women (67% vs. 47%) to say only a few or none of their close friends are LGBT.”
Or general trust in people:
“Bisexuals are somewhat less likely than lesbians and gay men to say that most people can be trusted. There are big differences in trust between bisexual men (45% say most people can be trusted) and women (29%).”
Most of these answers are surprising. I wonder what sort of repercussions we’ll see in mainstream media as a result as this problematic study.
It is interesting that lesbians and bisexuals feel like society is less accepting than gay men but that the LGBT community overall sees them as having more acceptance (well…bisexual women).
But thanks to everyone for pointing out the problems with the study as well.
As a relatively “straight-looking” bisexual woman, I’ve witnessed a lot of casual homophobia from people who would never say something like that in front of a person they read as queer. I wonder if the fact that bisexuals see society as less accepting might have something to do with that? We are less likely to be recognized as queer and so have a window into what people say when they think no one’s around who might be offended.
Then there’s the fact that the gay community is not very accepting of bisexuals, so we recognize that even the LGBT community is rife with bias (I’ve seen a lot of biphobia from gays/lesbians, lesbophobia from gay men, and transphobia everywhere).
Our society has become far more tolerant, but true acceptance has lagged behind. It is increasing as well, but we still have a ways to go.
There’s a huge difference between the sexualization of queer women to titillate straight men and actual acceptance. I’m going to guess that’s why bisexual women are seen as having the highest rates of acceptance, followed by lesbians.
This whole thing is just so problematic.
Kasey, I totally agree with what you’re saying about bi women’s objectification by straight men. Also, there are a large number of straight ID’d men who surreptitiously look at trans women in “shemale porn” (according to the best study of Internet porn “A Billion Wicked Thoughts,” it’s the fourth most common type of porn web site http://jezebel.com/5793986/fascinating-facts-about-internet-sex) yet I don’t see any degree of acceptance coming from that, most especially from straight men. Objectification is not the same as acceptance. Yet I think, on a phone survey, straight men are more likely to admit they’re okay with a bi cis woman (especially one they perceive as “looking straight”) than with, say, a bi woman they view as looking gender variant much less a trans woman. I think gender presentation (and body parts) have a lot to do with straight people’s comfort level when even talking about queer/trans people.